Stage to Stage
This is a simple workflow example involving converting points from one stage coordinate system to another. This workflow also works for importing .csv files of pixel x,y coordinates.
For this example we use:
INPUT: .csv - a list of x,y coordinates with names + more than 3 reference points
FORMAT: the transform requires column names of ‘x’ and ‘y’ and also recognises ‘name’ as spotnames
OUTPUT: pos, scancsv or csv file in laser coordinate system with corresponding spotnames
Input and output can be easily changed for your purposes see the contributions page for more information on how to contribute.
e.g. We have been using the workflow to ensure measurement of the same grain on both scanning electron microscope and the laser ablation system.
Step 1: Acquire coordinates
- save the coordinates of 3 or more registration points
- collect and save coordinates of phases of interest
Step 2: Export Point Coordinates to CSV
- Export the stage-coordinates of your planned points in x-y format to a CSV.
Optionally, specify names for each of the points, which could be used as an index later.
Step 3: Calibrate and Transform the points between the two stages
- Use autopew to transform all stage coordinates. See the example code below:
Note that the calibration of this transform involves a least-squares process to find the optimal transformation, such that adding more calibration points can help avoid minor inaccuracies in adding points.
Step 4: Export Points to for new Stage Coordinates
- Export the transformed point stage coordinates to a file you can import into the software controlling the new stage.
from autopew import Pew
from autopew.util.plot import plot_transform
# %% LOAD reference points and sample points ---------------------------------------------------------------
points = (Pew("Reference Points_source.csv",
"Reference Points_dest.csv")
.load_samples('Samples.csv'))
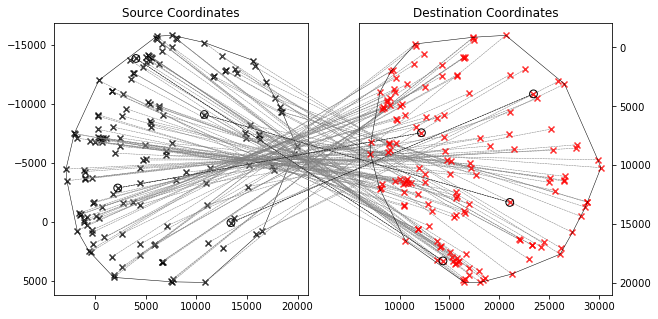
# %% VISUALISE THE TRANSFORM ---------------------------------------------------------------
fig = plot_transform(
points.samples[['x', 'y']].values,
points.transformed[['x', 'y']].values)
# %% EXPORT -----------------------------------------------------------
points.export_samples("Points_new.pos")
points.export_samples("Points_new.scancsv")
points.export_samples("Points_new.csv")
See also